Computer Vision
About
ApertoTech-Vision is an Open-Source computer vision project that uses pose estimation to analyze sprinting performance from 2D video. Developed with Python, OpenCV, MediaPipe, and JavaScript, I created it to track my sprinting speed and (hopefully) lay the groundwork for cost-effective sport science technology for athletes, trainers, and researchers.
Skills Involved
- Forward Kinematics
- Computer Vision
- Pose Estimation
- OpenCV
- MediaPipe
- JavaScript
- Data Analysis
- User Interface Design
- Cloud Integration
Procedure
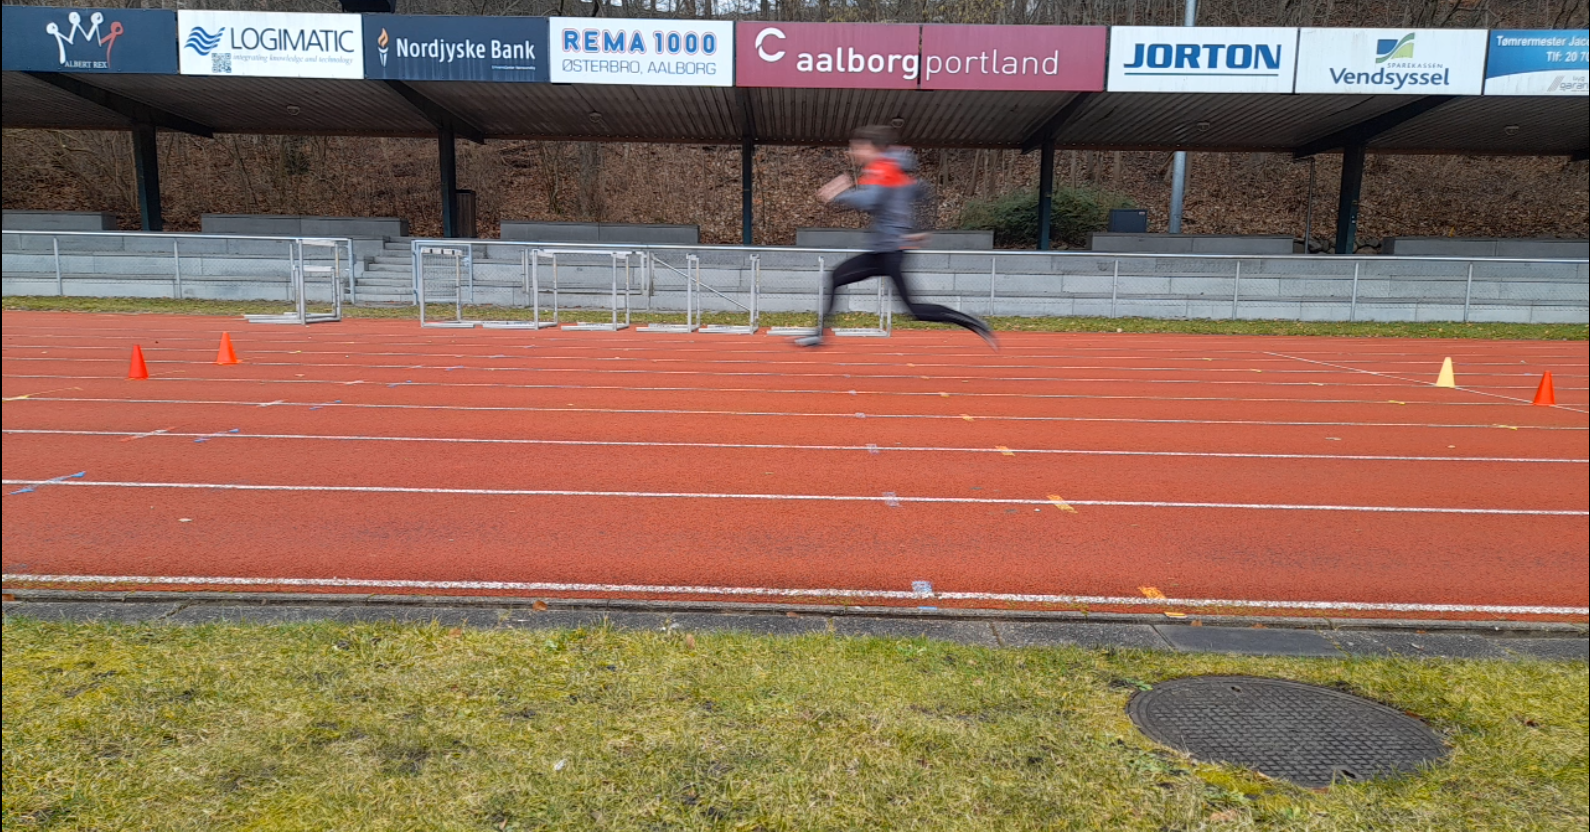
To use this software, users set up four fiducials (cones) measured to 10m, which sets the scale of their joint coordinates in frame. They record a 60-240 FPS video of themselves performing a 10m acceleration or a 10m “flying” sprint (a popular rep distance for max effort sprint training).
The analysis process involves several steps. A thresholding/convex hull algorithm attempts to detect cones to set the pixel scale, although this has proven unreliable in different environments where there is low light, reflective materials, or inconsistent coloration.
Alternatively, I created a method to manually click cones (in any order) to set the scale of pixels to meters within the frame of the video.
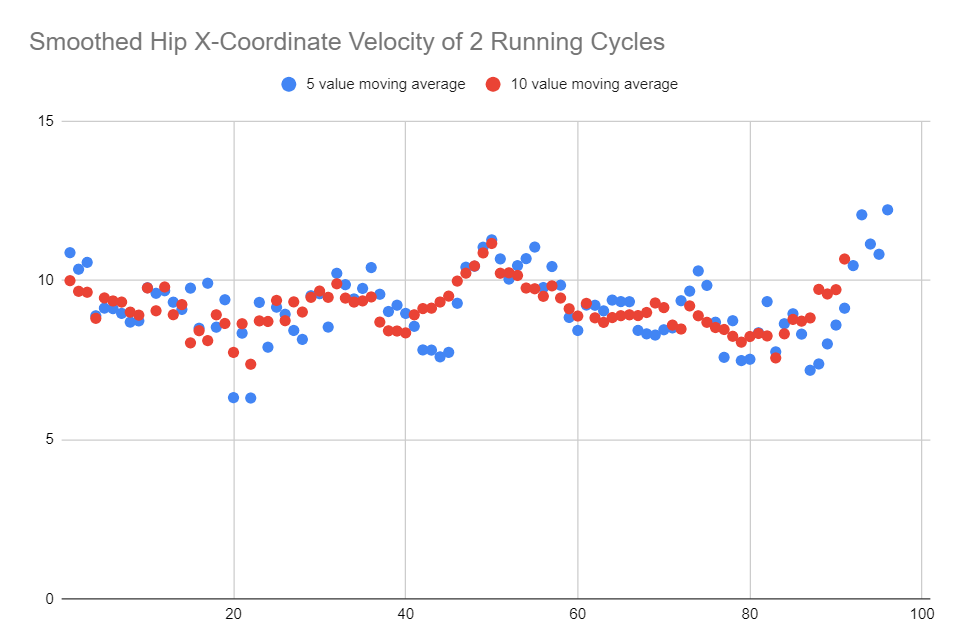
Step length and step frequency are derived from the data set of ankle, toe and heel coordinates. It was beneficial to include all three joint coordinates because of the high density of 2D points as the coordinates on frames are stacked up.
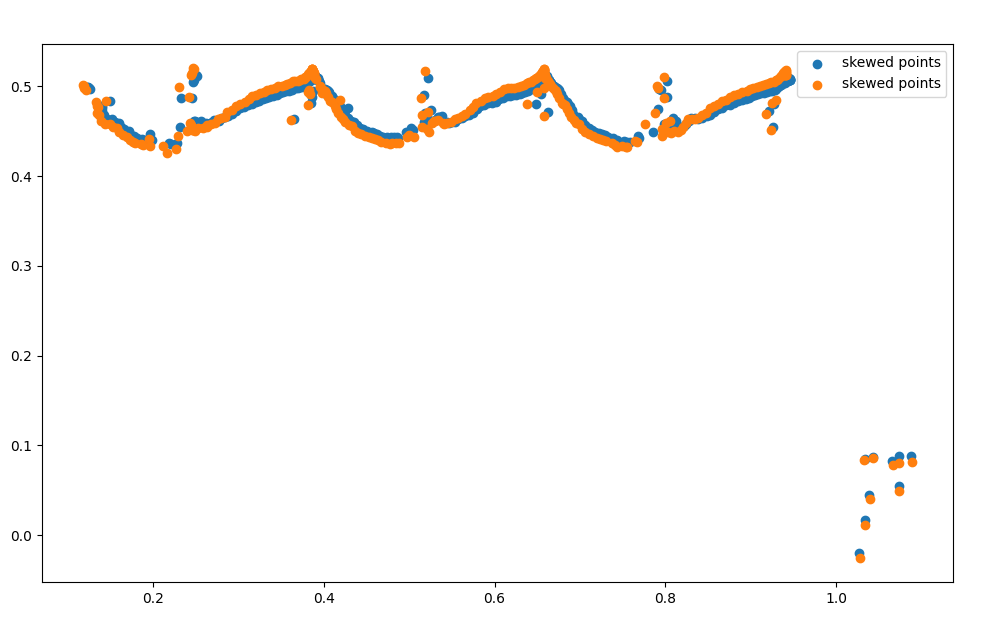
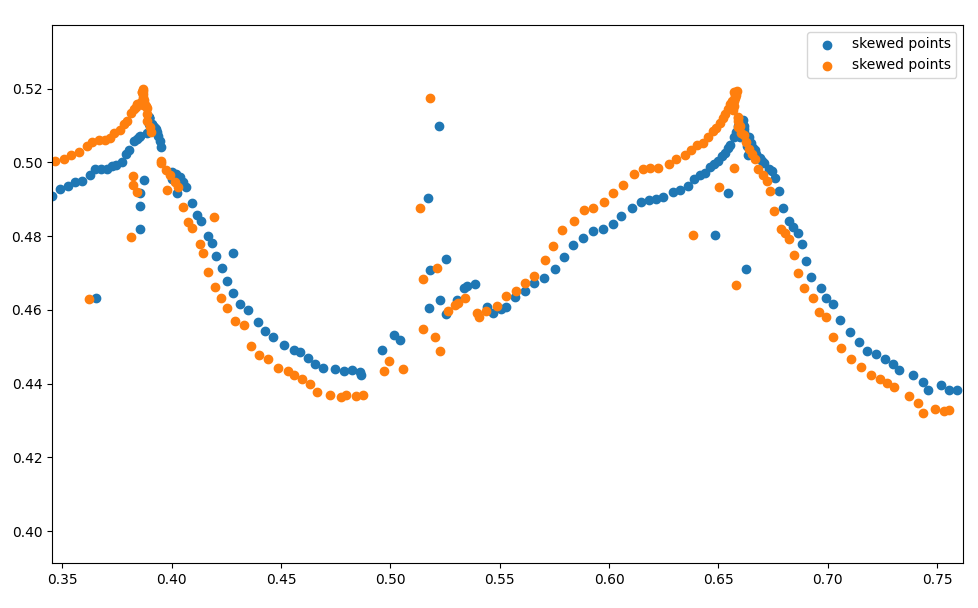
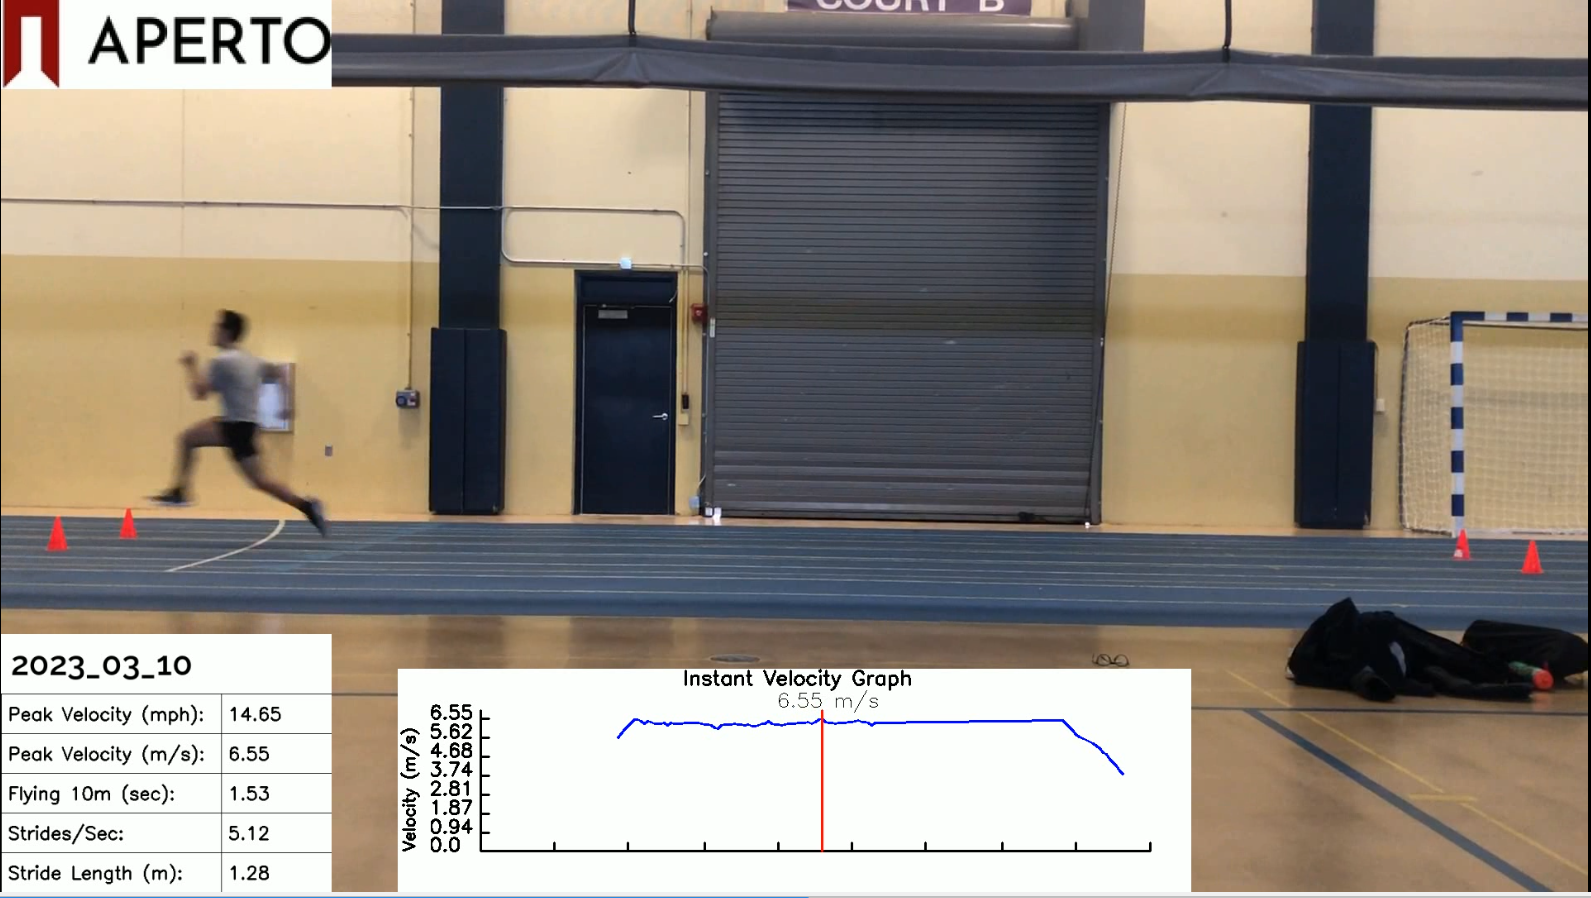
All data was aggregated and converted to computer graphics that was then overlayed to the original video. I had the idea to release this as a SaaS and reached out online to sprinters in Kenya, Ireland, Denmark and across the USA for testing before realizing the challenges in cone detection and user issues with different phones and perspectives.
Furthermore, I thought to address fiducial inaccuracies by adjusting instantaneous velocity points using a scale factor based on vantage point geometry. A solution I thought of but never was able to implement.
The ApertoTech-Vision system is best suited for lab settings, with effectiveness in larger training settings yet to be tested.
The project underwent multiple iterations, including a kinogram generator for “useful” positions to guide coaches on proper positioning.
